By Josué Medellín-Azuara and Jay Lund
When it comes to water, California’s irrigated agriculture is always under the public magnifying glass because it is the largest managed water use in the state and the economic base for many rural areas. During a prolonged drought like the current one, however, crop water comes under a microscope.
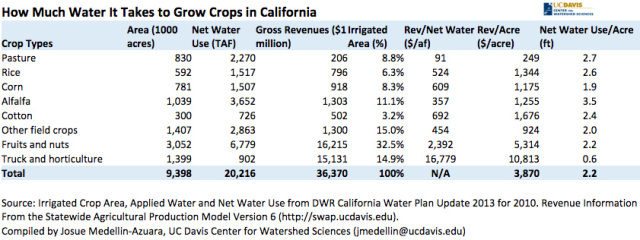
We have compiled a table to help answer questions on which crops use the most water and which crops provide the most economic “pop per drop.”
The estimates are very broad because California is so diverse in crop varieties, agricultural practices and local water availability. But the numbers are still useful for comparison purposes.
Note that the amount of water applied to a crop – “gross use” – is not the same as its “net use,” as some of that water seeps underground and replenishes aquifers or is reused downstream.
Some observations about the data:
- The “truck (vegetables) and horticulture (garden plants)” crop group has the highest revenue per net water use, followed by the “fruits and nuts” group. Together, these two large crop categories account for nearly 86 percent of all crop revenue, but occupy only 47 percent of the irrigated cropland and use just 38 percent of the water applied to that land.
- Fruits and nuts are grown on about one-third of the irrigated cropland and use one-third of the water, but produce nearly 45 percent of the total crop revenue.
- Alfalfa, corn irrigated pasture and other livestock fodder account for nearly 37 percent of all net water crop use, but produce less than 7 percent of total crop revenue. However, the ranches and dairies that depend on these foodstuffs generate more than 22 percent of California’s agricultural production value, which totaled $45 billion in 2012.
- Rice fields use a lot of water but also provide important bird habitat.
Josué Medellín-Azuara is a senior researcher and Jay Lund is a professor of civil and environmental engineering with the UC Davis Center for Watershed Sciences.


