Governor Edmund G. Brown Jr. today issued an executive order to establish a California greenhouse gas reduction target of 40 percent below 1990 levels by 2030 – the most aggressive benchmark enacted by any government in North America to reduce dangerous carbon emissions over the next decade and a half.
“With this order, California sets a very high bar for itself and other states and nations, but it’s one that must be reached – for this generation and generations to come,” said Governor Brown.
This executive action sets the stage for the important work being done on climate change by the Legislature.
The Governor’s executive order aligns California’s greenhouse gas reduction targets with those of leading international governments ahead of the United Nations Climate Change Conference in Paris later this year. The 28-nation European Union, for instance, set the same target for 2030 just last October.
California is on track to meet or exceed the current target of reducing greenhouse gas emissions to 1990 levels by 2020, as established in the California Global Warming Solutions Act of 2006 (AB 32). California’s new emission reduction target of 40 percent below 1990 levels by 2030 will make it possible to reach the ultimate goal of reducing emissions 80 percent under 1990 levels by 2050. This is in line with the scientifically established levels needed in the U.S. to limit global warming below 2 degrees Celsius – the warming threshold at which scientists say there will likely be major climate disruptions such as super droughts and rising sea levels.
Climate Adaptation
The executive order also specifically addresses the need for climate adaptation and directs state government to:
– Incorporate climate change impacts into the state’s Five-Year Infrastructure Plan;
– Update the Safeguarding California Plan – the state climate adaption strategy – to identify how climate change will affect California infrastructure and industry and what actions the state can take to reduce the risks posed by climate change;
– Factor climate change into state agencies’ planning and investment decisions; and
– Implement measures under existing agency and departmental authority to reduce greenhouse gas emissions.
California’s Response to Climate Change
In his inaugural address earlier this year, Governor Brown announced that within the next 15 years, California will increase from one-third to 50 percent our electricity derived from renewable sources; reduce today’s petroleum use in cars and trucks by up to 50 percent; double the efficiency savings from existing buildings and make heating fuels cleaner; reduce the release of methane, black carbon and other potent pollutants across industries; and manage farm and rangelands, forests and wetlands so they can store carbon.
Since taking office, Governor Brown has signed accords to fight climate change with leaders from Mexico,China, Canada, Japan, Israel and Peru. The Governor also issued a groundbreaking call to action with hundreds of world-renowned researchers and scientists – called the consensus statement – which translates key scientific climate findings from disparate fields into one unified document. The impacts of climate change are already being felt in California and will disproportionately impact the state’s most vulnerable populations.
The text of the executive order is below:
EXECUTIVE ORDER B-30-15
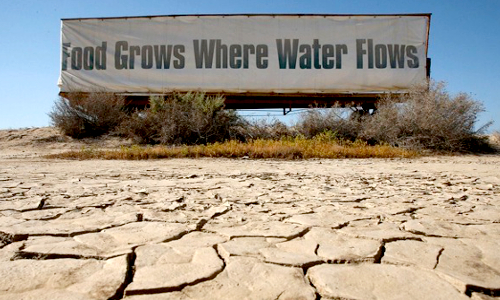
WHEREAS climate change poses an ever-growing threat to the well-being, public health, natural resources, economy, and the environment of California, including loss of snowpack, drought, sea level rise, more frequent and intense wildfires, heat waves, more severe smog, and harm to natural and working lands, and these effects are already being felt in the state; and
WHEREAS the Intergovernmental Panel on Climate Change concluded in its Fifth Assessment Report, issued in 2014, that “warming of the climate system is unequivocal, and since the 1950s, many of the observed changes are unprecedented over decades to millennia” and that “continued emission of greenhouse gases will cause further warming and long-lasting changes in all components of the climate system, increasing the likelihood of severe, pervasive and irreversible impacts for people and ecosystems;” and
WHEREAS projections of climate change show that, even under the best-case scenario for global emission reductions, additional climate change impacts are inevitable, and these impacts pose tremendous risks to the state’s people, agriculture, economy, infrastructure and the environment; and
WHEREAS climate change will disproportionately affect the state’s most vulnerable citizens; and
WHEREAS building on decades of successful actions to reduce pollution and increase energy efficiency the California Global Warming Solutions Act of 2006 placed California at the forefront of global and national efforts to reduce the threat of climate change; and
WHEREAS the Intergovernmental Panel on Climate Change has identified limiting global warming to 2 degrees Celsius or less by 2050 as necessary to avoid potentially catastrophic climate change impacts, and remaining below this threshold requires accelerated reductions of greenhouse gas emissions; and
WHEREAS California has established greenhouse gas emission reduction targets to reduce greenhouse gas emissions to 1990 levels by 2020 and further reduce such emissions to 80 percent below 1990 levels by 2050; and
WHEREAS setting an interim target of emission reductions for 2030 is necessary to guide regulatory policy and investments in California in the midterm, and put California on the most cost-effective path for long term emission reductions; and
WHEREAS all agencies with jurisdiction over sources of greenhouse gas emissions will need to continue to develop and implement emissions reduction programs to reach the state’s 2050 target and attain a level of emissions necessary to avoid dangerous climate change; and
WHEREAS taking climate change into account in planning and decision making will help the state make more informed decisions and avoid high costs in the future.
NOW, THEREFORE, I, EDMUND G. BROWN JR., Governor of the State of California, in accordance with the authority vested in me by the Constitution and statutes of the State of California, in particular Government Code sections 8567 and 8571 of the California Government Code, do hereby issue this Executive Order, effective immediately
IT IS HEREBY ORDERED THAT:
1.A new interim statewide greenhouse gas emission reduction target to reduce greenhouse gas emissions to 40 percent below 1990 levels by 2030 is established in order to ensure California meets its target of reducing greenhouse gas emissions to 80 percent below 1990 levels by 2050.
2.All state agencies with jurisdiction over sources of greenhouse gas emissions shall implement measures, pursuant to statutory authority, to achieve reductions of greenhouse gas emissions to meet the 2030 and 2050 greenhouse gas emissions reductions targets.
3.The California Air Resources Board shall update the Climate Change Scoping Plan to express the 2030 target in terms of million metric tons of carbon dioxide equivalent.
4.The California Natural Resources Agency shall update every three years the state’s climate adaptation strategy, Safeguarding California, and ensure that its provisions are fully implemented. The Safeguarding California plan will:
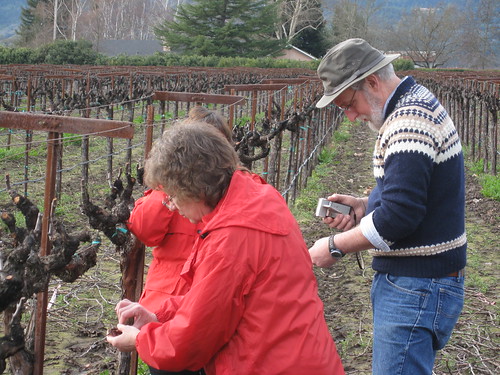
-Identify vulnerabilities to climate change by sector and regions, including, at a minimum, the following sectors: water, energy, transportation, public health, agriculture, emergency services, forestry, biodiversity and habitat, and ocean and coastal resources;
-Outline primary risks to residents, property, communities and natural systems from these vulnerabilities, and identify priority actions needed to reduce these risks; and
-Identify a lead agency or group of agencies to lead adaptation efforts in each sector.
5.Each sector lead will be responsible to:
-Prepare an implementation plan by September 2015 to outline the actions that will be taken as identified in Safeguarding California, and
-Report back to the California Natural Resources Agency by June 2016 on actions taken.
6.State agencies shall take climate change into account in their planning and investment decisions, and employ full life-cycle cost accounting to evaluate and compare infrastructure investments and alternatives.
7.State agencies’ planning and investment shall be guided by the following principles
-Priority should be given to actions that both build climate preparedness and reduce greenhouse gas emissions;
-Where possible, flexible and adaptive approaches should be taken to prepare for uncertain climate impacts;
-Actions should protect the state’s most vulnerable populations; and
-Natural infrastructure solutions should be prioritized.
8.The state’s Five-Year Infrastructure Plan will take current and future climate change impacts into account in all infrastructure projects
9.The Governor’s Office of Planning and Research will establish a technical, advisory group to help state agencies incorporate climate change impacts into planning and investment decisions.
10.The state will continue its rigorous climate change research program focused on understanding the impacts of climate change and how best to prepare and adapt to such impacts.
This Executive Order is not intended to create, and does not, create any rights or benefits, whether substantive or procedural, enforceable at law or in equity, against the State of California, its agencies, departments, entities, officers, employees, or any other person.
I FURTHER DIRECT that as soon as hereafter possible, this Order be filed in the Office of the Secretary of State and that widespread publicity and notice be given to this Order.
IN WITNESS WHEREOF I have hereunto set my hand and caused the Great Seal of the State of California to be affixed this 29th day of April 2015.
______________________________
EDMUND G. BROWN JR.
Governor of California
ATTEST:
______________________________
ALEX PADILLA
Secretary of State
Link to news release